August 19, 2018 by
Game Analysis of the 2018 Pros vs Joes CTF at BSidesLV

This was originally posted on blogger here.
Introduction
Capture the Flag (CTF) contests are a staple of security conferences and BSides Las Vegas is no exception. However the Pros vs Joes (PvJ) CTF I help support there is a bit unique. Not only is it a blue vs blue CTF with red aggressor and gray user teams, but the game dynamics are a fundamental development point for the CTF team. (There's a lot more to it such as it's educational goal or that we allow blue teams to attack each other on the second day. You can read more about it at http://prosversusjoes.net/.)
Game Dynamics
When we say 'game dynamics', we mean a couple of things. First we mean what's scored and how much. In our case that is currently four things:
- hosts (score given to teams for maintaining service availability)
- beacons (score deducted when the red team signals a host is compromised)
- flags (score deducted when the red team breaches specific files)
- tickets (score deducted when the gray team is not being appropriately supported)
At a more fundamental level though, we mean the scenario the CTF is meant to represent. As a blue team CTF, we try and simulate the real world. As such, starting last year, we began to transition our game model to simulate an economy. Score is not granted so much as transferred. For example, the gold team pays the gray team for accomplishing some task, then the gray team pays a portion of that score to the blue team for maintaining the services necessary to accomplish that task. Alternately, when the red team (or another blue team) installs a beacon, the score isn't lost, but instead transferred to the team that placed the beacon.
Simulation
The first thing we do is create a game narrative and scoring profile for the game. The profile is the servers that will come online, go offline, and how much they will be scored per (5 minute) round. It is picked to produce specific outcomes such as inflation (to decrease point value early in the game when teams are just getting going and to allow dynamism throughout the game).
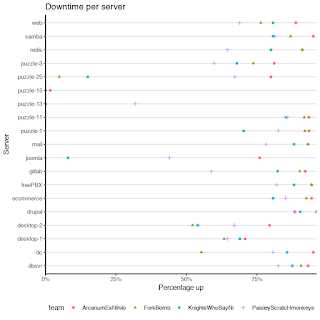
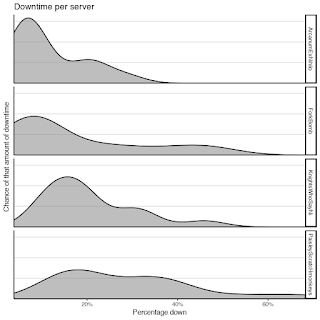
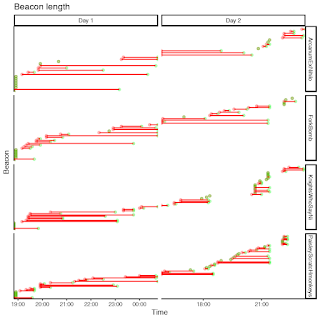
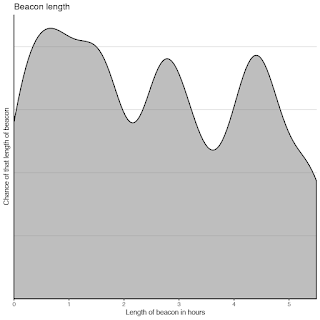
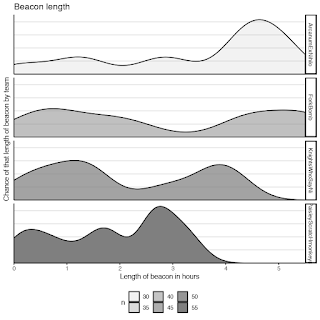
We then try and build distributions of how likely servers will be to go offline, how likely beacons will be and how long they will last, and how many flags will be found. This year we used previous years simulations and logs as well as expert opinion to build the distributions. The distributions we used are below:
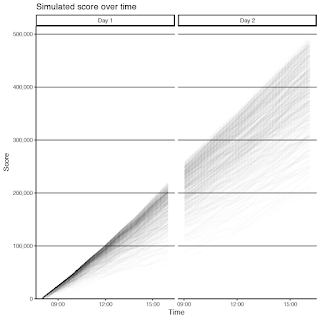
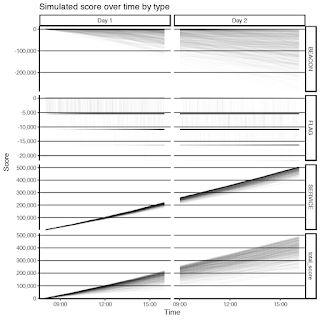
Based on this we ran Monte Carlo simulations to try and predict the outcome of the game.### Define distributions to sample from## Based on previous games/simulations and expert opinion# H&W outage distributionsdoutage_count <- distr::Norm(mean=8, sd = 8/3)doutage_length <- distr::Norm(mean=1, sd = 1/3)# flag distributionsdflags <- distr::Norm(mean=2, sd= 2/3) # model 0 to 4 flags lost with an average of 2# beacon distributionsgamma_shapes <- rriskDistributions::get.gamma.par(p=c(0.5, 0.7), c(0.75, 4)) # create a gamma distribution to draw number of tickets fromdbeacons_length <- distr::Gammad(shape=gamma_shapes['shape'], scale=1/gamma_shapes['rate']) # in hoursdbeacon_count <- distr::Norm((4-3)/2+3, (4-3)/3)
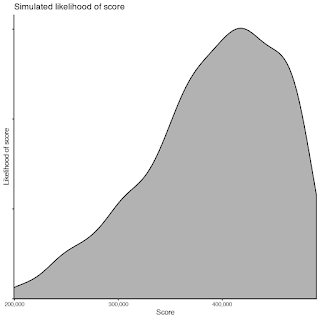
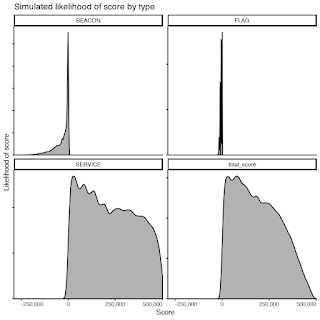
Finally we wanted to look at the distributions of potential final scores and the contributions from the individual scoring types
The Game
And then we run the game.
The short answer is, it's VERY different. We had technical issues that prevented starting the game on time. We were not able to complete some development that prevented automatic platform deployment, some hosts were not available, and some user simulation was also not available. This is not a critique of the development team who did a crazy-awesome job both rebuilding the infrastructure for this game in the months leading up to it as well as dynamically deploying hosts during the game. It's just reality. The scoring profile was built for everything we want. I am pleased with how much of it we got on game day.
The Scoreboard
 |
| The Final Scoreboard |
You can find the final scoreboard and scores here. It gives you an idea of what the game looked like at the end of the game, but doesn't tell you a lot about how we got there. I'm personally more interested in the journey than the destination so that I can support improving the game narrative and scoring profile for the next game.
Scores Over Time
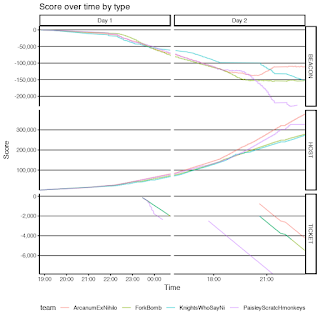
The first question is how did the scores progress over time? (You'll have to forgive the timestamps as they are still in UTC I believe.) What we hoped for was relatively slow scoring the first two hours of the game. This allows teams the opportunity to make up ground later. We also do not want teams to follow a smooth line or curve. A smooth line or curve would mean very little was happening. Sudden jumps up and down, peaks and valleys, mean the game is dynamic.
What we see is a relatively slow beginning game. This is due to beacons initially being scored below the scoring profile and one of three highly-scored puzzle servers being mistakenly scored lower from it's start late in day 1 until it was corrected at the beginning of day 2.
We do see an amount of trading back and forth. ForkBomb (as an aside, I know they wanted the _actual_ fork bomb code for their name, but for this analysis text is easier) takes an early lead while Knights suffer some substantial losses (relative to the current score). Day two scores take off. The teams are relatively together through the first half of day 2, however, Arcanum takes off mid-day and doesn't look back.
The biggest difference is that when teams started to have several beacons, as part of their remediation they tended to suffer self-inflicted downtime. This caused a compound loss of score (the loss of the host scoring they would have had plus the cost of the beacons). We did not account for this duplication in our modeling, but plan to in the future.
Ultimately I take this to mean scoring worked as we wanted it to. The game was competitive throughout and the teams that performed were rewarded for it.
It does leave the question of what contributed to the score...
Individual Score Contributions
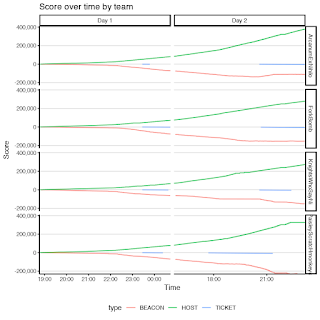
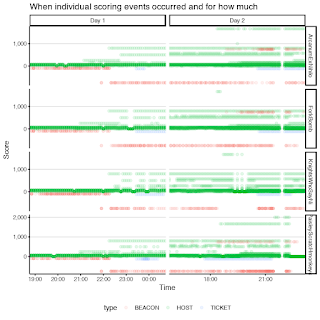
What we find is roughly what we expected but not quite. The rate of host contribution on day two is more profound than expected for both Paisley and Arcanum suggesting the second day services may have been scored slightly high.
Also, no flags were captured. However, we do have tickets which were used by the gold team to incentivize the blue teams to meet the needs of the gray team.
The biggest difference is in beacons. We see several interesting things. First, for a period on day two, Knights employed a novel (if ultimately overruled) method for preventing beacons. We see that in the level beacon score for an hour or two. We also see a shorter level score in beacons later on when the red team employed another novel (if ultimately overruled) method that was significant enough that had to be rolled back. We also see how Arcanum benefited heavily from the day 2 rule allowing blue-on-blue aggression. Their beacon contribution actually goes UP (meaning they were gaining more score from beacons than they were losing) for a while. On the other side, Paisley suffers heavily from blue-on-blue aggression with significant beacon losses.
Ultimately this is good. We want players _playing_, especially on day 2. Next year we will try to better model the blue-on-blue action as well as find ways to incentivize flags and provided a more substantive and direct way for the gray team to motivate the blue team.
But there's more to consider such as the contributions of individual hosts and Beacons to score.
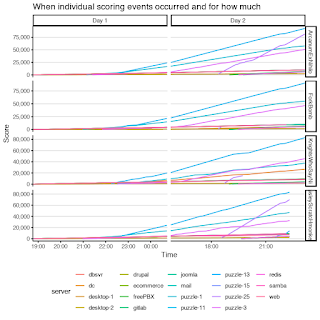
Hosts
More interesting are the differences in scoring for servers such as Redis, Gitlab, and Puzzle-1. This suggests maybe these servers are harder to defend as they provided score differentiation. Also, we notice teams strategically disabling their domain controller. This suggests the domain controller should be worth more to disinsentivize this approach.
Beacons
- Arcanum - 17
- ForkBomb - 24
- Knights - 18
- Paisley - 21
Conclusion
In conclusion, the take-away is certainly not how any given team did. As the movie "Any Given Sunday" implied, sometimes you win, sometimes you lose. What is truly interesting is both our ability to attempt to predict how the game will go as well as our ability to then review afterwards what actually happened in the game.
Hopefully if this blog communicates anything, it's that the scoreboard at the end simply doesn't tell the whole story and that there's still a lot to learn!
Future Work
This blog is about scoring from the 2018 BSides Las Vegas PvJ CTF so doesn't go into much detail about the game itself. There's a lot to learn on the PvJ website. we are also in the process of streamlining the game while making the game more dynamic. As mentioned above, the process started in 2017 and will continue for at least another year or two. Last year we added a store so teams can spend their score. We also started treating score as a currency rather than a counter.
This year we added additional servers coming on and off line at various times as well as began the process of updating the gray team's role by allowing them to play a puzzle challenge hosted on the blue team servers.
In the next few years we will refine score flow, update the gray team's ability to seek compensation from the gray team for poor performance, and additional methods to maximize blue team's flexibility in play while minimizing their requirements. Look forward to future posts as we get the details ironed out!
16 comments captured from original post on Blogger
High Technologies Solutions said on 2019-05-24
very useful information shared by you.I would appreciate if you would share more information about other courses. advanced excel training center in delhi advanced excel training center in delhi advanced excel training center in delhi
Renuraj said on 2019-06-24
This blog is very informative and excellent post gained a lot of information. good job.Oracle DBA Training in Chennaioracle apps dba training in chennaiSpark Training in ChennaiTableau Training in ChennaiLinux Training in ChennaiUnix Training in ChennaiPower BI Training in ChennaiJob Openings in ChennaiAppium Training in ChennaiOracle DBA Training in VadapalaniOracle DBA Training in Velachery
for ict 99 said on 2019-09-20
Great Article Artificial Intelligence Projects for CSE Project Centers in Chennai JavaScript Training in Chennai JavaScript Training in Chennai
Chris Hemsworth said on 2019-12-06
I have been reading for the past two days about your blogs and topics, still on fetching! Wondering about your words on each line was massively effective. Techno-based information has been fetched in each of your topics. Sure it will enhance and fill the queries of the public needs. Feeling so glad about your article. Thanks…! best software testing training in chennai best software testing training institute in chennai with placement software testing training courses software testing training and placement software testing training online software testing class software testing classes in chennai best software testing courses in chennai automation testing courses in chennai
Monisha said on 2019-12-06
I like the helpful info you provide in your articles. I’ll bookmark your weblog and check again here regularly. I am quite sure I will learn much new stuff right here! Good luck for the next!Web Designing Training Institute in Chennai | web design training class in chennai | web designing course in chennai with placement | Web Designing and Development Course in Chennai | Web Designer Training Course in Chennai Mobile Application Development Courses in chennai Data Science Training in Chennai | Data Science courses in Chennai Professional packers and movers in chennai | PDY Packers | Household Goods ShiftingWeb Designing Training Institute in Chennai | Web Designing courses in Chennai Google ads services | Google Ads Management agencyWeb Designing Course in Chennai | Web Designing Training in Chennai
priya said on 2020-02-24
I have been reading for the past two days about your blogs and topics, still on fetching! Wondering about your words on each line was massively effective.php online training in chennaiphp programming center in chennaiphp class in chennnai php certification coursephp developer training institution chennaiphp training in chennnaiphp mysql course in chennaiphp institute in chennnaiphp course in chennnaiphp training with placement in chennnaiphp developer course
priya said on 2020-02-24
Nice post. Thanks for sharing! I want people to know just how good this information is in your article. It’s interesting content and Great work.appium online trainingappium training centres in chennaibest appium training institute in chennnaiapppium coursemobile appium in chennnaimobile training in chennnaiappium training institute in chennnai
w3webschool said on 2020-03-17
Such a wonderful article and I feel that it is best to write more on this topic. Thank you so much because i learn a lot of ideas about it. Keep posting…Digital Marketing Course In KolkataWeb Design Course In KolkataSEO Course In Kolkata
Anurag Srivastava said on 2020-03-23
Thanks for sharing an informative blog keep rocking bring more details.I like the helpful info you provide in your articles…Various state governments also conduct recruitment comes to fill up the vacancies in Sarkari result, departments and ministries of the state government.
Pooja said on 2020-04-03
Thanks for sharing this information. FreeJobAlert is one of the best website to get Latest Govt Jobs Information and to know more about Rojgar Nirman visit official website.I liked Your Article.
Rathinam said on 2020-04-21
Thank you much more for sharing the wonderful post. Keep updating here…Excel Training in ChennaiExcel Advanced coursePega Training in ChennaiLinux Training in ChennaiGraphic Design Courses in ChennaiTableau Training in ChennaiUnix Training in ChennaiOracle Training in ChennaiSoft Skills Training in ChennaiJMeter Training in ChennaiExcel Training in OMR
Shanejo said on 2020-05-13
It’s very useful blog post with inforamtive and insightful content and i had good experience with this information.I have gone through CRS Info Solutions Home which really nice. Learn more details About Us of CRS info solutions. Here you can see the Courses CRS Info Solutions full list. Find Student Registration page and register now. Go through Blog post of crs info solutions. I just read these Reviews of crs really great. You can now Contact Us of crs info solutions. You enroll for Pega Training at crs info solutions.
divya said on 2020-06-10
nice and wonderful article . i would love to visit again again your website share more Ai & Artificial Intelligence Course in Chennai PHP Training in Chennai Ethical Hacking Course in Chennai Blue Prism Training in Chennai UiPath Training in Chennai
shiny said on 2020-06-24
This blog on information security analytics is instructive and educative. Thanks for sharing this blog. Web Designing Course Training in Chennai | Web Designing Course Training in annanagar | Web Designing Course Training in omr | Web Designing Course Training in porur | Web Designing Course Training in tambaram | Web Designing Course Training in velachery
Keerthi SK said on 2020-09-22
I was following your blog regularly and this one is very interesting and knowledge attaining. Great effort ahead. you can also reach us for web design company in chennai web development company in chennai website designers in chennai website designing company in chennai web design in chennai website development company in chennai
Banumadhu said on 2021-01-13
Excellent blog thanks for sharing the valuable information..it becomes easy to read and easily understand the information.Useful article which was very helpful. also interesting and contains good information. to know about python training course , use the below link.Python Training in chennaiPython Course in chennai
